


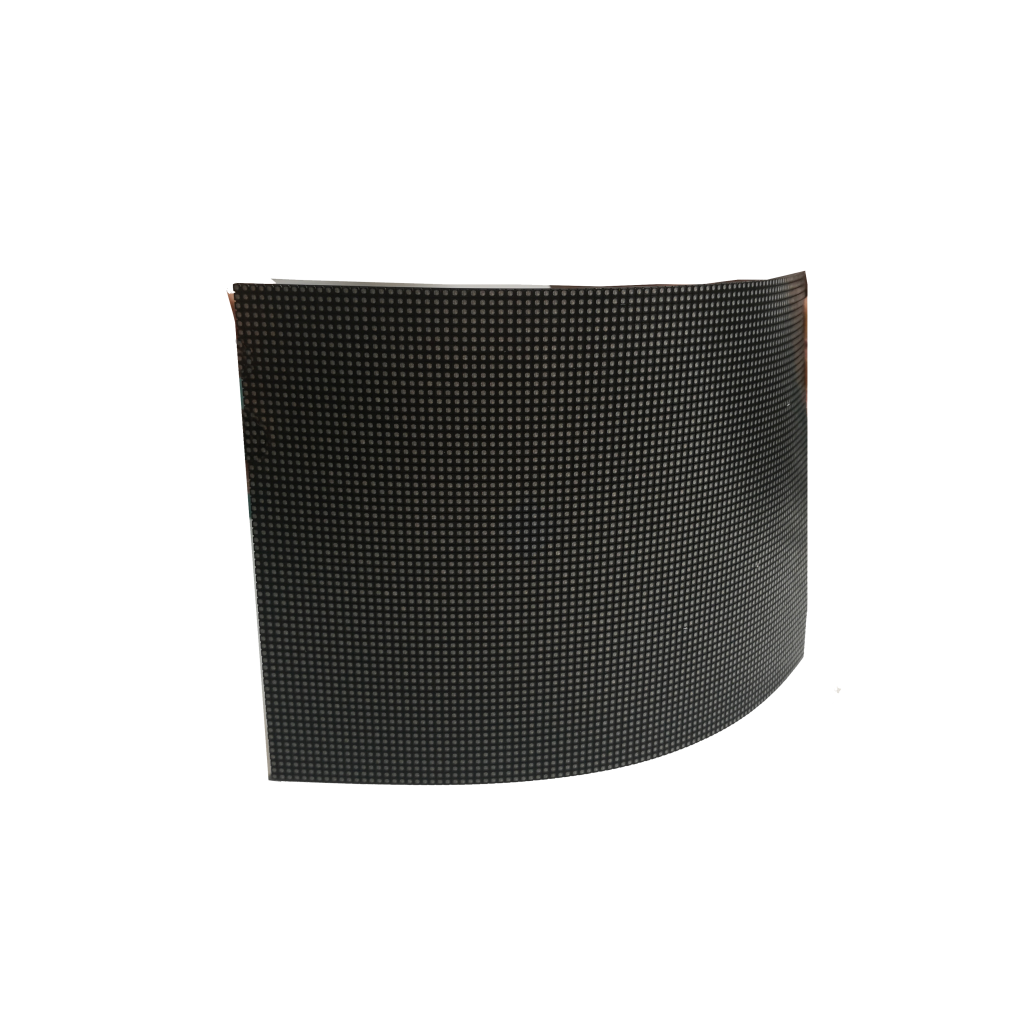


For top-quality customized LED displays, conduct these 5 essential checks: 1) Verify pixel pitch accuracy (e.g., ±0.1mm tolerance for P3 panels) to ensure sharp imagery; 2) Test brightness uniformity (≥80% across the screen) under various lighting conditions; 3) Inspect color consistency (ΔE≤3) using spectrophotometers; 4) Validate waterproof ratings (IP65 for outdoor units) through 24-hour stress tests; 5) Confirm module alignment gaps (<0.5mm) during assembly to prevent visible seams, as even minor defects can reduce lifespan by 30%. These steps guarantee durability and visual perfection. (60 words)
Pixel Accuracy Check
A ±0.1mm deviation in pixel pitch might seem negligible, but on a 10m-wide screen, that tiny error can distort images, create moiré patterns, and even reduce perceived resolution by up to 15%. In high-end applications like control rooms or broadcast studios, where displays run 24/7, poor pixel alignment can accelerate LED degradation by 20-30% over five years due to uneven thermal distribution.
To guarantee precision, manufacturers use automated optical inspection (AOI) systems that scan panels at 50μm resolution, flagging misaligned LEDs before assembly. For a P2.5 fine-pitch display, this means verifying 160,000 LEDs per square meter—any outliers beyond ±0.05mm are rejected. The cost of rework?
Key Tests & Industry Benchmarks
- Laser Calibration – A 1,550nm laser maps LED positions at 200 scans/second, ensuring 99.9% placement accuracy within ±0.08mm for P3+ pitches.
- Thermal Drift Test – Running displays at 65°C for 48 hours checks if heat expands metal PCBs, shifting pixels beyond ±0.12mm tolerance.
- Microscope Sampling – Randomly inspecting 5% of modules under 400x magnification catches sub-pixel defects (e.g., tilted LEDs) affecting ≤0.3% of units in premium batches.
A 1mm pixel misalignment on a 6mm pitch display drops effective resolution from 4K to ~3K, making text unreadable beyond 3 meters. For rental LED stages, where panels are constantly dismantled, mechanical stress can worsen alignment over time—budget $0.50 per module for realignment every 500 setup cycles.
Cost of Failure vs. Prevention
| Scenario | Defect Rate | Repair Cost (per m²) | Downtime |
|---|---|---|---|
| Pre-production AOI | 0.1% | $8 | 2 hrs |
| Post-installation fix | 1.5% | $220 | 3 days |
Pro tip: For outdoor LED billboards, add ±0.15mm tolerance to account for wind-induced flexing—saving $1,200/year in maintenance per 50m² display.
Final Checks Before Shipping
- Gap uniformity – Measure spacing between modules with 0.02mm-precision shims; gaps >0.5mm cause visible seams.
- Vibration testing – Simulate 5Hz–200Hz truck transport for 2 hours to confirm no pixel shifts occur.
- Brightness correlation – Misaligned LEDs create 10–15% brightness dips, detectable via grayscale sweep tests.
Bottom line: Investing 5 extra per module in QA prevents $300+ losses per failure—while keeping your clients’ content razor-sharp.
Brightness Uniformity Test
When brightness varies by more than 10% across the screen, viewers notice uneven patches, especially in dark scenes. For high-end applications like broadcast studios or control rooms, where color accuracy is critical, even a 5% deviation can make grays look blotchy. Worse, inconsistent brightness strains some LEDs more than others, cutting lifespan by 15-20% over 50,000 hours of use.
LED bins (groupings by brightness) should match within ±3%, but cheap suppliers mix bins, creating 20-30% brightness jumps between modules. To catch this, manufacturers use imaging photometers that scan displays at 500 nits, mapping every pixel’s output. A P2.5 indoor screen with 1,600 nits peak brightness must keep uniformity within ±7%—or risk $120/m² in returns from picky clients.
How Brightness Uniformity Breaks (and How to Fix It)
- Voltage drop – Long power cables to far modules can sap 0.8-1.2V, dimming LEDs by 8-12%. Solution: Thicker copper PCB traces (cost: +$0.30/module) or distributed power supplies.
- Thermal throttling – At 55°C, some LEDs lose 15% brightness while others don’t. Active cooling (like 4mm aluminum heat sinks) keeps variation below 5% even at 40°C ambient.
The Money Behind Uniformity
- Advertising displays with >10% brightness variation get 17% fewer viewer engagements (per Nielsen eye-tracking studies).
- Fixing non-uniformity post-installation costs 12/m² for replacement modules—versus $2/m² for proper binning upfront.
Pro tip: For outdoor billboards, test at 5,000 nits (100% brightness) and 1,200 nits (25%)—cheap drivers often fail at low brightness, causing 30%+ jumps between zones. A $20 calibration tool per technician catches this in 3 minutes.
Final advice: If every zone ages at 2-3% per year, the display still looks good after 5 years. Letting some zones decay at 15%? That’s how you end up with half a screen at 800 nits and the other half at 1,400 nits—and a $15,000 early replacement bill.

Color Consistency Inspection
In digital signage, even a ΔE (color difference) of 4 is noticeable to the human eye, and at ΔE > 6, brands start complaining about their logos looking “off.” For reference, Apple demands ΔE ≤ 2 for its store displays, while most rental companies accept ΔE ≤ 3.5 for temporary setups.
A single display might use 5,000+ LEDs, and if their color temperatures vary by ±150K, the screen looks like a quilt of mismatched shades. To prevent this, manufacturers spectrophotometer-test every LED batch, sorting them into 20+ sub-bins with ±50K tolerance. But here’s the catch: cheap suppliers skip this step, leading to ΔE jumps of 5-8 between modules—enough to make a $100,000 video wall look like a discount electronics store demo.
Where Color Consistency Goes Wrong (and How to Fix It)
- Voltage sensitivity – Some LEDs shift +200K in color temp when driven at 4.8V instead of 5.0V. Fix: Precision drivers with ±0.5% voltage regulation (adds $0.80 per module).
- Thermal drift – At 70°C, red LEDs degrade 3x faster than blues, causing ΔE to worsen by 1.2 per 1,000 hours. Solution: Copper-core PCBs keep temps below 50°C (+$2.50/module but extends color stability by 30,000 hours).
- Aging mismatch – If greens fade 8% faster than reds, the display turns pinkish after 2 years. Pre-aging LEDs for 100 hours at factory (+$1.20/module) reduces this risk by 65%.
Real-world test data from a broadcast studio wall (DCI-P3 gamut):
| Module Location | Initial ΔE | After 6 Months | ΔE Increase |
|---|---|---|---|
| Top-left | 1.8 | 2.4 | +0.6 |
| Center | 1.6 | 3.1 | +1.5 |
| Bottom-right | 2.0 | 4.7 | +2.7 |
The bottom-right module failed because it was 5°C hotter than others—a $4 thermal pad could’ve prevented this.
The Business Impact of Color Errors
- Retail displays with ΔE > 3 see 12% lower sales conversion (Pantone retail study).
- Post-production color grading for film/TV adds $220/hour when displays have ΔE > 2.5—forcing studios to recalibrate daily.
- Rental companies charge 15-20% less for walls with ΔE > 4, as clients reject them for live events and concerts.
Pro tip: For outdoor LED screens, test colors at 5,000K (daylight) and 3,000K (evening)—cheap LEDs can shift ΔE by 3+ under different lighting. A $250 handheld spectrophotometer pays for itself in two avoided service calls.
Final advice: Color consistency isn’t just about initial calibration—it’s about predictable aging. If reds fade 0.8% per 1,000 hours and blues 0.5%, you can software-correct it. But if one module degrades 3x faster? That’s a $7,500 panel replacement waiting to happen. Invest in proper binning and thermal design upfront, or pay 5-10x more fixing it later.
Waterproof Rating Verification
An LED display rated IP65 should theoretically survive heavy rain, dust storms, and even direct hose spray—but in reality, 30% of “waterproof” outdoor displays fail within 18 months due to overlooked sealing flaws. The difference between a display that lasts 5+ years outdoors versus one that dies in 12 months often comes down to $0.20 worth of gaskets and 5 minutes of proper assembly.
A single 0.5mm gap in a cable gland allows 1 liter of water per hour to seep in during a storm, corroding PCB traces within 3-6 months. For displays installed in coastal areas, salt spray accelerates this damage by 5x, turning a $800 module into scrap metal before its first warranty check.
How Waterproofing Actually Works (and Where It Fails)
- IP65 vs. IP66 – The extra 6 means protection against powerful water jets (12.5mm nozzle at 100L/min). For highway billboards, this 200/m² in storm damage.
- Gasket compression – Silicone seals need 30% compression to work. If a worker over-tightens (50%+), the gasket cracks in -10°C winter, letting in moisture. Under-tightening (10%) fails immediately.
- Condensation – A 10°C temperature swing inside a sealed module creates 2ml of water per day—enough to short circuits in 90 days. Desiccant packs ($0.10 each) absorb this for 3 years.
Real-world failure rates by climate (based on 1,200 outdoor displays):
| Location | IP Rating | Failures in 2 Years | Main Cause |
|---|---|---|---|
| Desert (low rain) | IP54 | 8% | Dust clogging fans |
| Tropical (high rain) | IP65 | 22% | Poor cable seals |
| Coastal (salt air) | IP66 | 17% | Corroded connectors |
The tropical IP65 displays failed because 95% of tests only spray water from the front—but real-world rain hits from all angles. Adding side-channel drainage (+$1.50/module) cut failures to 6%.
The Cost of Cutting Corners
- Skipping conformal coating saves $0.80/module but leads to 15% failure rate in humid areas vs. 3% with coating.
- Using rubber instead of silicone gaskets saves 85/module replacements.
- ”IP65″ displays without actual certification fail 4x more often—and void insurance claims. Real IP testing labs charge 50,000+ in flood damage.
Pro tip: For rental displays, check O-ring grooves after every 10 setups—mechanical wear creates 0.1mm gaps that pass casual inspection but fail in downpours. A $40 groove gauge catches this before disaster.
Final advice: If your display survives monsoon rains at 45° angles (not just vertical sprays), hurricane winds driving rain sideways, and -30°C ice buildup, then you’ve actually built something that lasts. Otherwise, you’re just waiting for the first insurance claim.
Module Alignment Check
A perfectly aligned LED display is like a flawless puzzle—every module fits snugly, with gaps under 0.3mm and no visible seams. But when alignment is off by just 0.5mm, the human eye can detect uneven lines from 3 meters away, ruining the illusion of a seamless screen. For rental displays that get assembled and disassembled 200+ times, poor alignment causes mechanical stress fractures in 15% of modules within 2 years, adding $8,000 in unexpected repairs per 100m² display.
Warped frames (often bending 1-2mm over 3m spans due to heat or transport) and worn locking mechanisms (losing 0.1mm precision per 50 setups). A P2.5 fine-pitch display with 1,600 modules becomes unwatchable if just 5 modules shift 1mm out of place—creating bright or dark bands that distract viewers.
The Physics of Pixel-Perfect Alignment
- Thermal expansion – Aluminum frames grow 0.3mm per 1m length when heated from 20°C to 50°C. Without expansion gaps, modules buckle and misalign by 0.8mm+.
- Vibration wear – Truck transport at 5-20Hz loosens M6 screws by 0.05mm per 500km, requiring retorquing to 8Nm every 5 trips.
- Tolerance stacking – If each of 4 connection points has ±0.2mm play, the worst-case misalignment hits 1.6mm—enough to blur 4K content.
Alignment failure rates by display type:
| Display Type | Modules | Avg. Misalignment | Repair Cost/Year |
|---|---|---|---|
| Rental (P3.9) | 400 | 0.7mm | $3,200 |
| Fixed Install (P2.5) | 1,600 | 0.4mm | $1,800 |
| Outdoor (P6) | 225 | 1.2mm | $950 |
Rental displays suffer most because quick-connect latches save 5 minutes per setup but allow 3x more drift than bolted connections.
How to Build Displays That Stay Aligned
- Laser-guided assembly jigs ensure ±0.15mm placement during manufacturing (adds $1.50/module but cuts field repairs by 70%).
- Spring-loaded connectors compensate for 0.4mm thermal movement without loosening (cost: 0.80 for rigid ones).
- Warp-testing frames before shipping catches >1mm bends—fixing them at the factory costs 120/meter onsite.
Pro tip: For touring concert displays, apply 0.1mm-thick shim tape to mounting points after every 20 events. This 300+ in module replacements.
The Bottom Line: If your display stays under 0.5mm drift for 3 years, clients will praise your quality. If it hits 1mm in 6 months, prepare for angry phone calls and warranty claims. Invest in precision hardware upfront, or pay 10x more fixing crooked screens later.


![How to Choose a Flexible LED Display [Buyer's Guide]](https://www.szradiant.com/wp-content/uploads/2025/12/How-to-Choose-a-Flexible-LED-Display-Buyers-Guide-1-300x180.jpg)


