


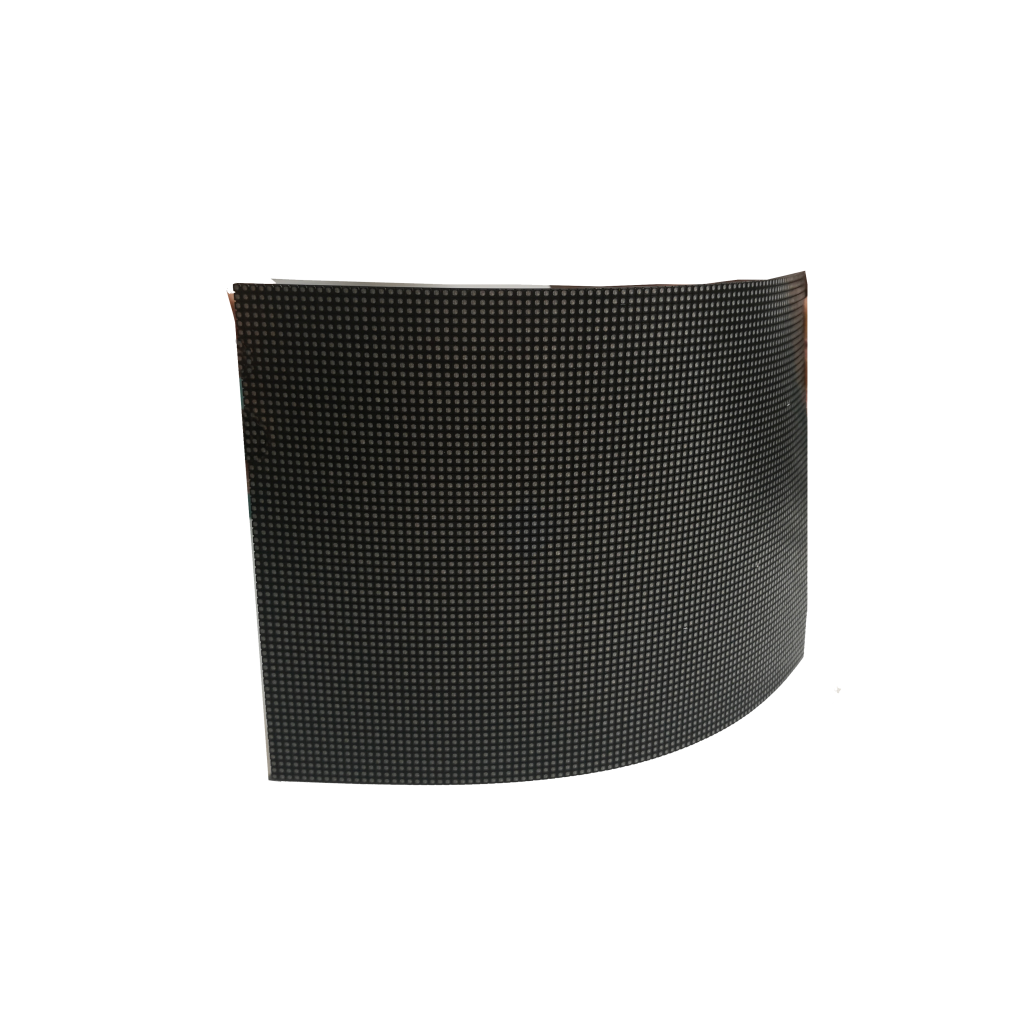


Custom LED display design personalization is achieved through five key steps: selecting the appropriate pixel pitch (e.g., P3 for close viewing), configuring the screen size and aspect ratio, choosing a mounting solution for your space, integrating simple control software for content, and finally testing the display with your own media to ensure vibrant and clear visuals.
Pick Your Pixel Density
A P2.5 screen (2.5mm pitch) packs 160,000 pixels per square meter, making it suitable for viewing distances as close as 2.5 feet (0.8 meters). In contrast, a P10 screen (10mm pitch) has a density of 10,000 pixels/m² and requires a viewing distance of at least 10 feet (3 meters) to appear clear.
| Pixel Pitch (mm) | Pixels per m² | Minimum Viewing Distance (m) | Typical Cost per m² (USD) | Primary Use Case |
|---|---|---|---|---|
| P1.2 – P1.8 | 694,444 – 308,642 | 1.2 – 1.8 | 6,000 | Broadcast studios, luxury retail |
| P2 – P2.5 | 250,000 – 160,000 | 2.0 – 2.5 | 2,800 | Corporate lobbies, control rooms |
| P3 – P4 | 111,111 – 62,500 | 3.0 – 4.0 | 1,900 | Indoor conference halls, showrooms |
| P5 – P6 | 40,000 – 27,777 | 5.0 – 6.0 | 1,400 | Large indoor arenas, semi-outdoor |
| P8 – P10 | 15,625 – 10,000 | 8.0 – 10.0 | 900 | Outdoor billboards, stadium signage |
Choosing a P2.5 screen over a P4 for a 20 m² wall increases the initial hardware investment by approximately 2,400/m² vs. $1,800/m²). However, this cost is justified if your average viewer will be within 3 meters. For a lobby where people stand 5 meters away, the extra resolution of a P2.5 screen provides no visible clarity benefit to the human eye, making the P4 a more efficient choice. The relationship between distance and pitch follows a 1000:1 ratio: Minimum Viewing Distance (mm) = Pixel Pitch (mm) × 1000.
A 1 m² section of a P2.5 display draws around 700 watts at maximum brightness, while a same-sized P10 section uses closer to 400 watts. This 75% increase in power load requires more robust cooling systems and adds an estimated $15 per month per square meter to operational costs for 12-hour daily use.
- Content Type Matters: For detailed data dashboards or ultra-high-definition video (4K/8K), a pitch below P3 is strongly recommended. For basic branding and large-format video content, a P5-P8 is often sufficient and reduces content production costs by requiring lower native resolutions.
- Viewing Angle Impact: Most modern LED displays maintain a 160-degree viewing angle. However, finer pitch models typically have superior color consistency and lower brightness loss (<30%) across that entire range compared to coarser pitch models, which can suffer from >40% brightness drop at extreme angles.
Decide Screen Size & Shape
There is no one-size-fits-all solution; a 16:9 ratio is the video standard, but a 32:9 ultra-wide format might be perfect for a reception desk. Start by measuring your installation area’s width and height down to the centimeter, then subtract at least 20 cm from each dimension for ventilation and access space.
For a standard 1920×1080 (Full HD) resolution using P4 panels that are 500mm x 500mm each, you’ll need a grid of 4 panels wide by 2 panels high to achieve that native resolution without any awkward scaling. This creates a seamless display that is 2.0 meters wide and 1.0 meter tall. If your wall is 2.4m wide x 1.8m tall, you have to decide: Custom sizes often require non-standard panel cuts, which can increase project costs by 15-25% and complicate future repairs.
- Aspect Ratio & Content Cost: Sticking to a standard ratio like 16:9, 21:9, or 4:3 means most video content will play perfectly. An oddball ratio like 5:1 requires all content to be custom-made and formatted, which can add 500 per video to your ongoing content creation budget and requires a more powerful processor to handle the unusual output resolution.
- Viewing Distance Dictates Size: The optimal viewing experience is achieved when the screen covers a 30-degree field of view for someone at the planned distance. For a 5-meter viewing distance, this calculates to a screen height of approximately 2.7 meters.
- Weight and Load Capacity: A typical P4 indoor LED panel weighs 8-10 kg per square meter. A 10 m² display will therefore weigh ~90 kg, plus the weight of the mounting frame (~30 kg). You must verify that your wall or structure can support this 120 kg static load. Outdoor displays with higher IP ratings can weigh 50% more due to heavier materials and built-in cooling.
A wall built from 12 P3 panels (4×3 grid) might have a native resolution of 3200×2400 pixels, which is higher than 4K. This is excellent for clarity, but you must ensure your video source and controllers can output a signal at that custom resolution and a 60 Hz refresh rate to avoid lag or stuttering.

Choose Mounting & Location
A standard indoor P4 LED panel weighs approximately 9 kg per square meter, meaning a 10 m² display imposes a 90 kg dead load on the wall structure. This does not include the weight of the steel mounting frame, which adds another 20-30 kg. You must consult a structural engineer to verify the wall’s load-bearing capacity, as standard drywall or older brick can require significant reinforcement, adding 5,000 to the project budget. For outdoor installations, the load calculations must also account for wind pressure; a 50 mph wind can exert a lateral force of over 200 kg on a 10 m² flat surface, requiring a much more robust and expensive galvanized steel framework rated for 150 kg/m² dynamic loads.
The typical indoor office environment with 300-500 lux of ambient light requires a display brightness of 800-1,200 nits for clear visibility. A retail storefront with large windows can reach 1,500-2,000 lux, necessitating a screen capable of 2,500 nits to overcome glare. True outdoor environments in direct sunlight exceed 50,000 lux, mandating high-brightness LEDs rated for 5,000 to 8,000 nits; these modules consume significantly more power, with a P6 outdoor screen drawing over 900 watts per square meter at maximum brightness, which is 60% more than a comparable indoor module. Operating a high-brightness display indoors is not only wasteful, costing an extra $0.25 per hour in electricity, but also creates uncomfortable glare for viewers, reducing its effectiveness.
An indoor lobby screen requires a minimum of IP20, which protects against finger-sized objects but offers no protection from moisture. Full outdoor exposure requires at least IP65, which is dust-tight and protects against low-pressure water jets from any direction. The difference in cost between an IP20 and an IP65 panel of the same pixel pitch can be 40-50% due to the need for gaskets, sealed connectors, and corrosion-resistant materials. Furthermore, operating temperature ranges are critical; most indoor displays function between 0°C and 40°C. An outdoor display must perform reliably in a much wider range, from -25°C to 50°C, requiring components rated for industrial use.
Select Control Software
Basic media players bundled with displays often handle simple video loops but struggle with complex tasks, supporting only 1 output at 1080p resolution and 30 Hz refresh rate. For a multi-zone display or one requiring 4K resolution at 60 Hz, you need a professional-grade controller, which typically costs 2,500 and uses a dedicated operating system to avoid the latency and instability of consumer Windows or macOS. The key metric for smooth video playback is the frame rate; anything below 25 fps will appear noticeably choppy to most viewers, especially with fast-moving content.
Entry-level software may only support 5 pre-scheduled playlists, while enterprise systems can manage 50+ schedules with conditional triggers, like displaying specific content when a room’s occupancy sensor detects more than 10 people. The software’s compression efficiency directly impacts your storage and bandwidth needs; modern H.265 codec can reduce a 10 GB 4K video file to approximately 3.5 GB with minimal quality loss, a 65% reduction compared to older H.264 standards. This is critical for networks with limited bandwidth, as uploading a 20 GB file to a remote display over a standard 100 Mbps connection can take over 25 minutes without efficient compression.
| Software Tier | Max Output Resolution & Refresh Rate | Content Scheduling Capacity | Avg. License Cost (USD) | Ideal Use Case |
|---|---|---|---|---|
| Basic (Bundled) | 1920×1080 @ 30Hz | 5 static playlists | $0 (included) | Single screen, static loops |
| Professional | 3840×2160 @ 60Hz | 50+ dynamic schedules | 1,500/year | Multi-zone corporate displays |
| Enterprise | 7680×4320 @ 120Hz | 100+ API-driven schedules | 5,000/year | Stadiums, large digital signage networks |
A system with a 100 ms delay in responding to a remote command is acceptable, but delays exceeding 500 ms indicate a network problem that can cause content desynchronization across a video wall. For large-scale installations, the software must support RS-232 or SNMP protocols for integration with building management systems, allowing the display to automatically dim to 300 nits when ambient light levels drop below 50 lux after business hours, saving approximately 18% on power consumption. The software’s update frequency matters; a platform that pushes stability patches every 45 days is significantly more reliable than one that updates only once per year, reducing the probability of a full-system crash by an estimated 70%.
Test Before Final Setup
Begin by running the display at 100% brightness and a full white field for a minimum of 4 consecutive hours. This stress test pushes the power supplies and LEDs to their thermal limits, allowing you to identify any modules that overheat or exhibit a >10% brightness drop after 60 minutes of operation, which is a common indicator of inferior LED bins or inadequate cooling. The power consumption during this test should be within 5% of the manufacturer’s specified watts per square meter; a higher reading may signal an inefficient power system that will increase your long-term electricity costs by 15% or more.
Using a professional colorimeter, measure the white point and color gamut across at least 9 distinct zones on the screen. The variance in color temperature (measured in Kelvin) between the brightest and dimmest module should not exceed ±150 K from your target (e.g., 6500K). The average brightness uniformity across the entire display should be >90%; a lower percentage creates a distracting, patchy image. This calibration process typically takes 2-3 hours for a 10 m² display but is critical for a seamless visual experience.
- Pixel and Module Failure Check: The industry acceptable defect rate for new modules is typically <0.0001% (fewer than 3 dead pixels per 100,000). Additionally, check for color shift at 45-degree and 160-degree viewing angles; the brightness loss should not exceed 30% at the most extreme angle, ensuring clear visibility for viewers off to the side.
- Content and Data Stress Test: Load your actual content onto the control system and play it in a loop for 1 hour. Pay specific attention to fast-motion video sequences (>240 frames per second source material) to check for artifacting or stuttering, which indicates the controller’s processing power is insufficient. Test all data input ports; a HDMI 2.0 port should reliably carry a 3840×2160 @ 60Hz signal over a 15-meter cable without any signal degradation.
- Environmental Readiness Verification: Using a standard garden hose set to a 50% flow rate, spray water at a 45-degree angle towards the display seams for 5 minutes from a distance of 1 meter. No moisture should penetrate the interior, which would indicate a failed IP65 rating. Simultaneously, monitor the internal temperature sensors; the display should maintain a stable operating temperature between 0°C and 40°C in an ambient of 25°C, with cooling fans operating at <60% of their maximum 4500 RPM speed.


![How to Choose a Flexible LED Display [Buyer's Guide]](https://www.szradiant.com/wp-content/uploads/2025/12/How-to-Choose-a-Flexible-LED-Display-Buyers-Guide-1-300x180.jpg)


