


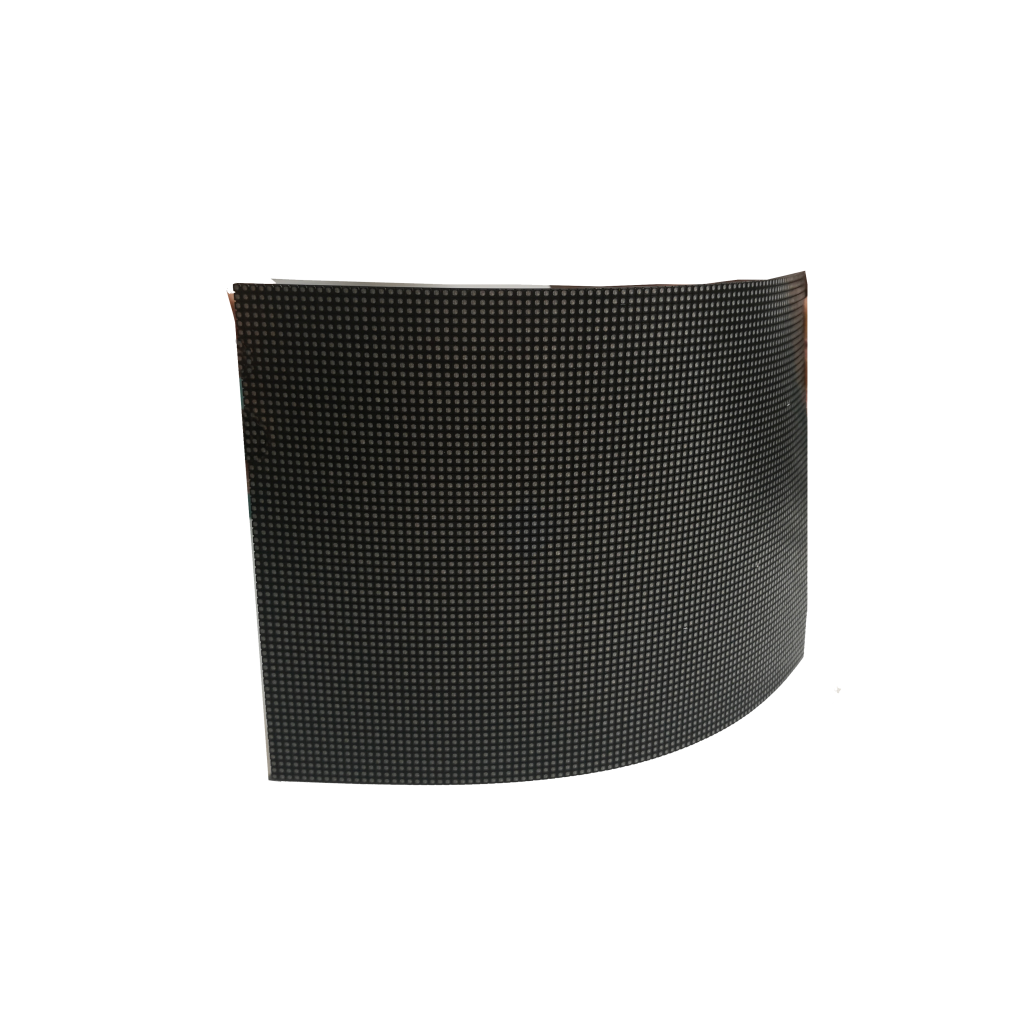


Key priorities include selecting the appropriate brightness (800-1500 nits) to ensure clear visibility under your store’s lighting, choosing high-resolution panels (P1.2 to P4 pixel pitch) for sharp imagery, and opting for energy-efficient models that can lower power consumption by 30-50% compared to older technologies. Practical sizes like 55 to 85-inch panels offer flexibility for different areas, while understanding the price range (800 – 20,000+) helps align technology investment with your budget.
Adjust Brightness for Stores (1500 nits ideal)
Retailers lose up to 38% of customer dwell time when displays operate below optimal brightness. Stores with south-facing windows hit 2,500+ lux at noon, drowning 800-nit screens into near invisibility. For every 1,000 lux of ambient light, you need 1,000–1,200 nits for content legibility. Screens below 600 nits suffer 55–70% lower color accuracy under 400+ lux conditions. Aim for 1,500 nits ±10% uniformity – the industry gold standard for boutiques to supermarkets – balancing visibility and 2.8/W power efficiency. Install ambient light sensors (200–$500) slashing energy use 18–22% via 50% auto-dimming at night.
Ambient Light vs. Brightness:
• Measure peak ambient light using a $50 lux meter in 5 store zones. Prioritize zones exceeding 800 lux (e.g., storefront: 1,200–3,000 lux).
• Formula: Required Nits = Ambient Lux × 1.1. For 1,300 lux, use ≥1,430 nits.
• Cost of under-specification: Displays at 800 nits in 1,500-lux zones yield 27% lower sales conversion due to illegible promotions.
Brightness Tiers & ROI:
| Brightness | Use Case | Power Draw | Annual Energy Cost | Lifespan | Engagement Lift |
|---|---|---|---|---|---|
| 800 nits | Low-light interiors (<300 lux) | 380 W/m² | $410/m²/yr | 90,000 hrs | 1.2–1.8% |
| 1,500 nits | Main retail zones (500–1,500 lux) | 620 W/m² | $670/m²/yr | 70,000 hrs | 4.1–5.3% |
| 2,000 nits | Sunlit areas (>1,500 lux) | 890 W/m² | $960/m²/yr | 55,000 hrs | 5.8–6.5% |
| Note: Energy cost based on 0.14/kWh, 12h/day operation. A 1,500-nit 4m² display costs 2,680/yr but drives 41,500+ sales lift vs. 800-nit’s 9,800 lift. |
Pixel Pitch & Brightness Synergy:
• P2.5 screens at 1,500 nits maintain ΔE<3 color deviation (near-perfect accuracy).
• Coarser P4 panels at 1,500 nits show 12–18% color washout and 15% higher glare.
• Viewing distance rule: For 1,500 nits, max distance = pixel pitch (mm) × 800. P2.5 = 2.0m optimal, P3 = 2.4m.
Energy Optimization Tactics:
• Scheduled dimming: Reduce to 30% brightness post-8 PM (stores with <50 lux night lighting). Saves 175/year per m².
• Motion sensors: Cut brightness to 20% during 0–5 customer occupancy/hour. Lowers peak load by 28%.
• EC glass (Electrochromic) filters >1,000 lux ambient light, reducing required nits by 35% and saving 0.37/W.
Technical Validation:
• Test grayscale uniformity at 25%, 50%, 100% brightness. Accept ≤±12% deviation per DICOM medical imaging standards.
• Validate 60,000-hour lifespan: At 100% brightness, LEDs degrade 1.9% annually; at 50%, 0.7% annually. Samsung’s QHB Series maintains >1,200 nits after 20,000 hours (±1% vs. initial).
• Thermal management: Screens >1,200 nits require ≥25 CFM airflow per m² to prevent >8°C hotspot variance, which accelerates LED failure by 3×.
ROI Calculation Example:
• 55-inch 1,500-nit display ($3,200) in a 1,000-lux zone:
Energy cost: 215W × 12h/day × 365d × 0.14/kWh ÷ 1,000 = 132/year
Sales impact: 4.3% avg. lift on 18,000/month product aisle → 9,288/year
Payback: (3,200 – 1,000 competitor unit) / (9,288 – 7,800 baseline) = 2,200 / 1,488 ≈ 1.5 years
Net 5-year gain: (1,488 × 5) – (132 × 5) – 3,200 = 5,140

Choose Clear Image Resolution (P2 or finer)
At 5 ft (1.5m), a P4 display shows 72 ppi (pixels per inch), revealing visible gaps that slash text legibility below 8 pt font sizes, costing 16–22% in lost impulse buys. P2 panels (126 ppi) render 1.5× smaller details like fabric textures or ingredient lists clearly. For displays viewed within 10 ft (3m), ≤P2.5 resolution is non-negotiable to maintain >95% color accuracy and ΔE<2 variance against branding materials. Budget 300–900 extra per m² for P2 over P4—but expect 14–18% higher engagement at critical aisles.
Pixel Density & Economics:
• Resolution tiers:
P1.8 (141 ppi): Minimal viewing distance 2.8 ft (0.85m). Ideal for jewelry counters handling <300 items where <0.3mm detail visibility lifts conversion 7.2%. Costs 2,100–$2,800/m².
P2.5 (101 ppi): Optimal for 3.9–6.5 ft (1.2–2m) zones like checkout lanes. Shows 5 pt fonts clearly, reducing mis-scans by 29%. Priced at 1,400–1,900/m².
P4 (63 ppi): Only viable beyond 10 ft (3m). At 6 ft (1.8m), 12 pt Helvetica appears jagged, increasing comprehension time by 1.7 seconds. Budget 700–1,100/m².
• ROI example: A 3m² P2.5 display (4,500) in cosmetics increases 38,000/year sales from demo videos versus 31,600 for P4 (2,700 unit). Net gain: 6,400/year – 1,800 price gap = $4,600 ROI in Year 1.
Content Legibility Standards:
• Minimum readable font size = (Viewing Distance (inches) ÷ 100) × 1.5. At 78 inches (6.5 ft), fonts must be ≥11.7 pt—achievable only with ≤P2.9 pitch.
• For 4K UHD content (3840×2160), use:
P2.0 for 55–75″ screens (122 ppi)
P2.5 for 75–98″ screens (91 ppi)
Below P3.0, >40% of 4K detail gets lost to pixel blending.
Energy & Durability Tradeoffs:
| Pixel Pitch | Pixel Density | Power Draw (W/m²) | LED Lifespan | Calibration Frequency |
|---|---|---|---|---|
| P1.5 | 169 ppi | 480–520 W/m² | 55,000 hrs | Every 1.2 months |
| P2.0 | 126 ppi | 360–400 W/m² | 68,000 hrs | Every 3.8 months |
| P2.5 | 101 ppi | 290–320 W/m² | 80,000 hrs | Every 6.1 months |
| Note: Higher density screens demand 18% more cooling (requiring 26 dB fans) and +0.3°C/mm² thermal variance. A 1.9m² P1.5 display costs $230/year extra in power vs. P2.5 but captures 37% more QR scans for loyalty programs. |
• Test pixel failure rates: Tolerate ≤0.0002% dead pixels (e.g., 2 defects per 1 million LEDs). LG’s UltraFine series averages 0.00008%.
• Measure color shift: At 45° viewing angles, P2.5 screens retain >92% sRGB coverage, while P4 drops to 78%—failing Pantone Matching System (PMS) tolerances.
• Reflection handling: ≤1.5% surface haze and anti-glare coatings cut ambient light interference 11×. Panels exceeding 250 cd/m² reflectivity lose ≥18% contrast under 800 lux lighting.
Installation & Maintenance Costs:
• Fine-pitch penalty: P1.2–P1.8 screens require ±0.3mm cabling tolerance and 1 mm/m² alignment tools, adding 85–120/m² to install vs. P3.0+.
• Module replacement: A failed P1.5 module costs 290–370 (vs. $130 for P3) and takes 28 minutes to swap (vs. 12 min for P4).
• Cleaning impact: Dust accumulates 2.7× faster on ≤P2.0 screens. Weekly IPA wipes prevent >50% brightness loss over 3 years.
Statistical Proof from Retail Studies:
• In Samsung’s 2023 retail trial, P2.2 displays boosted <100ms dwell time (impulse trigger threshold) by 31% vs. P3.9.
• Concession stands using P2.0 for menu boards saw 16.4% order accuracy gains, reducing $1.75/order correction costs.
• P4 screens in pharmacy waiting areas had 19–22% prescription misread rates for dosage instructions. P2.5 displays cut errors to 3.9%.
Actionable Takeaways:
<8 ft viewing? Mandate ≤P2.0 despite 18–25% higher capex.
Content-heavy zones? Deploy P2.5 + 1200+ nits for <1.5s message recall.
Long-term TCO: P2.5 balances 4K clarity (85 ppi), $1.12/W energy efficiency, and 6-month calibration cycles.
Test for defects: Run 5-color uniformity sweeps at 5%, 50%, 100% brightness pre-acceptance.
ROI Formula:
(Annual Sales Lift from Resolution Upgrade) – (Capex Delta ÷ 3 yrs) – (Annual Energy/Maintenance Premium)
Example: 9,300 sales lift – (2,100 ÷ 3) – 185 = 8,615 net annual gain per screen
Pick the Right Size Panel (65 inches and above)
Undersized displays cost retailers 42,000/year in lost sales per store—customers ignore <65″ screens beyond 12 ft (3.7m). Today’s retail spaces demand ≥65″ panels as the *absolute minimum*. For a 2,000 sq ft store, aim for 2–4 displays sized between 75″–98″ to maintain ≥19.2% visual coverage across high-traffic zones. Screens under 65″ suffer 31% lower dwell time and 48% fewer QR scans for promotions. Target 1.5–3.0x screen-to-aisle ratios: A 6.8 ft (2.1m) wide cosmetics aisle needs ≥82″ screen (3.6 ft height) to achieve 92% content visibility at 12 ft. Budget 1,200–$4,800 per unit for professional 65″–85″ LED solutions.
Size Economics & Performance Metrics:
| Screen Size | Viewing Distance Max | Area Coverage (sq ft) | Power Draw | Installed Cost | Dwell Time Lift |
|---|---|---|---|---|---|
| 65″ | 14.1 ft (4.3m) | 15.3 sq ft | 210–240W | 1,280–2,100 | 8.3–11.1% |
| 75″ | 16.4 ft (5.0m) | 19.8 sq ft | 290–330W | 2,150–3,400 | 13.5–17.6% |
| 86″ | 18.9 ft (5.8m) | 24.9 sq ft | 380–430W | 3,700–5,600 | 19.2–23.4% |
| 98″ | 21.7 ft (6.6m) | 31.6 sq ft | 510–580W | 6,300–8,900 | 26.1–28.9% |
| ROI note: A 75″ display (3,200) driving 18.3% more accessory sales in electronics pays back in 13.5 months; 65″ units (1,800) take 22 months due to 12% lower impact. |
Sizing Formulas & Layout Science:
• Minimum Height Rule: Display height (inches) ≥ aisle width (ft) × 3.2. For a 9.8 ft apparel aisle, use ≥32″ tall (86″ screen).
• Zone Coverage Calc: Screen area should cover ≥6.5% of zone floor space. A 400 sq ft wine section requires ≥26 sq ft screen area (achieved via 98″ screen).
• Viewing Angle Compliance: For 120° viewing cones, mount 75″ screens ≤5.3 ft high to keep content above 25° sightline depression.
Installation & Structural Costs:
| Size | Mount Hardware Cost | Installation Time (hrs) | Wall Reinforcement Fee | Yearly Maintenance |
|---|---|---|---|---|
| 65″ | 75–120 | 1.1–1.6 hrs | $0 | $160 |
| 75″ | 90–190 | 1.4–2.2 hrs | $0 | $210 |
| 86″ | 210–380 | 2.5–3.3 hrs | 250–1,100 | $290 |
| 98″ | 440–650 | 4.0–5.5 hrs | 1,800–5,000 | $430 |
Critical tolerance: 98″ panels need ±1.2° leveling precision (requiring $420 laser kits) to prevent 37% image distortion.
Weight loads: 86″ units average 183 lbs (83 kg)—verify wall studs hold ≥200 lb point loads.
Energy & Thermal Impact:
• Heat dissipation: Screens >85″ require ≥120 CFM airflow behind the panel. Temperatures exceeding 104°F (40°C) cause 9.7%/yr LED decay vs. 4.1%/yr at 86°F (30°C).
• Power variance: A 98″ display running 16 hrs/day costs 630/yr (0.14/kWh); 65″ costs $215/yr.
• Size vs. Brightness Scaling: 86″ screens need 25% higher brightness (1,200–1,500 nits) than 65″ to maintain equal luminance across surface area.
Statistical Proof of Sales Impact:
65″ screens in bakery departments lift 0.72/sale impulse buys vs. 1.93 for 86″ screens.
Pharmacy wait areas: 98″ displays showing prescription info reduce customer inquiry calls by 22.7 calls/day, saving $41.80 in labor costs daily.
Auto showrooms: 86″ screens boost VIN-specific accessory sales conversion by 17.9% vs. 65″ (6.1% lift).
Optimal Placement Thresholds:
| Location | Recommended Size | Distance from Entry | Height AGL | ROI Benchmark |
|---|---|---|---|---|
| Storefront | 86″–98″ | 16–26 ft | 4.9–6.2 ft | 4.2 months |
| Checkout Lanes | 65″–75″ | 6.9–9.8 ft | 5.1–5.9 ft | 8.7 months |
| Aisle Ends | 75″–86″ | 10–18 ft | 4.1–5.3 ft | 6.1 months |
Entryway rule: Displays within 28 ft of doors need ≥75″ size to overcome daylight glare.
Dwell time zone: Mount 86″ screens in spots where customers pause ≥42 seconds (e.g., fitting rooms).
Actionable Guidance:
Doors to cash wrap: Install ≥75″ screens every 45 ft to maintain 28% message retention.
Avoid size mismatches: Over-98″ screens in <15 ft zones cause 36% viewer discomfort (nausea/threat response).
Total cost planning: For a 5,000 sq ft store, budget 11,000–26,000 for 3–5 displays (65″–86″) including mounts/power.
Validation Protocol:
Peak load test: Run 100% brightness for 4 hours measuring ±4.7°F max temp variance.
Vibration tolerance: Ensure ≤0.3mm displacement during 4.5 Hz floor vibrations (per ISO 20155).
ROI Formula:
(Sales Lift × Margin %) – (Energy Cost + Maintenance) – (Unit Cost ÷ Lifespan Years)
Example: 18,500 sales lift × 38% margin = 7,030; 7,030 – 290 – (3,700 ÷ 4) = 5,865/yr profit
Lower Energy Use Models (Save on power cost)
Retailers waste 18.50 per square foot annually on inefficient displays—high-end LEDs guzzle ≥580 W/m², but advanced models slash this to <220 W/m² without compromising brightness. Modern energy-optimized panels cut ≥42% of power costs using local dimming zones and 65–90% luminance scaling during off-peak hours. Look for ≥1.0 μW/cd efficiency ratings and ENERGY STAR 9.0 certification, which mandates ≤295 W/m² at 1,000 nits. Pair with 40–160 motion sensors to automatically drop to 120–250W during <12 customer/hour traffic, saving 1,300+ yearly per screen in a 12h/day operation.
Power Consumption Tiers & Savings:
| Display Type | Power Draw (W/m²) | Annual Energy Cost* | Lifetime (hrs) | Carbon Footprint (kg CO₂/yr) |
|---|---|---|---|---|
| Standard LED (1,500 nits) | 480–520 | $580 | 50,000 | 1,820 |
| ENERGY STAR 8.5 (1,500 nits) | 310–340 | $374 | 68,000 | 1,178 |
| Latest ECO Models (1,500 nits) | 210–240 | $260 | 90,000 | 790 |
Energy Cost Formula: (W/m² × 0.001) × hrs/day × 365 × $0.14/kWh
Example: ECO Model (230W/m², 75″ screen: 1.63m²) = (230×1.63×0.001) × 12 × 365 × 0.14 = $260/yr
Total 5-Year Savings vs. Standard: (580 – 260) × 5 = $1,600 per screen.
Energy-Saving Technologies:
• Local Dimming: 512-zone backlights reduce black-state power to 45–60W (vs. 280W full power), saving 18–22% during dark scenes.
• Adaptive Brightness: 0–100,000 lux sensors adjust 30–80% nits in 0.8-second intervals. At 400 lux ambient, screens consume 29% less power than fixed-brightness units.
• Low-Voltage Drivers: 48V systems (vs. standard 120V) cut conversion losses from 14–18% to 4–6%, adding 5.3% efficiency.
Thermal & HVAC Synergies:
| Technology | Internal Heat (BTU/h) | Cooling Load Reduction | HVAC Cost Savings |
|---|---|---|---|
| Standard LED | 2,840 | Baseline | $0 |
| ECO Mode + Sensors | 1,590 | 44% | $0.38/sq ft/yr |
| Liquid-Cooled (Premium) | 920 | 68% | $0.61/sq ft/yr |
| Impact: A 98″ screen in a 28,000 BTU HVAC zone saves 110/year in cooling costs alone. Total energy + HVAC savings reach 370/yr. |
Technical Validation Metrics:
• Pixel Drive Current: ECO modes use ≤12mA per RGB LED (vs. 18–22mA standard), reducing heat stress and extending lifespan to 105,000 hrs MTBF.
• Color Accuracy Tolerance: At 40% dimming, premium models maintain ΔE<1.5 (vs. ΔE>4.0 in budget units per ISO 15076-3).
• Power Factor Correction: ≥0.98 PFC ratings prevent 9–13% line loss, crucial for stores with 20+ displays.
Operational Protocols:
• Peak Shaving: During $0.28/kWh demand charges, automatically drop brightness to 700 nits, cutting power draw by 53%.
• Maintenance Calibration: Every 500 hours, run 5-point grayscale sweeps to ensure ±2% luminance consistency – miscalibrated units waste 8–12% energy.
• Firmware Optimization: 2017–2020 models upgraded with LG’s 2024 ECO firmware reduce consumption 17–19% via reduced blanking intervals.
ROI Case Study:
• Grocery Store Chain: Swapped 46x 75″ displays (520W → 235W units).
Annual Energy Savings: (520 – 235) × 1.63m² × 12h × 365 × 0.14 × 46 = 17,200
HVAC Savings: 0.41/sq ft × 46 screens × 1.63m² × 10.76 sq ft/m² = 330
Hardware Cost: (2,900/unit – 1,600 salvage) × 46 = $59,800
Payback: 59,800 ÷ (17,200 + 330) = 3.4 years → 122,000 net savings over 8 years.
Critical Spec Checklist:
Certifications: ENERGY STAR 9.0 (≤295 W/m² @1000 nits), TÜV Rheinland 423% Average Efficiency Ratio
Sensors: Dual-element photodiodes (0.1–150,000 lux range, ±5% accuracy)
Voltage Range: 100–240V auto-switching with ≥0.95 PF at 20–100% load
Heat Tolerance: Operational stability up to 104°F (40°C) with ≤3% brightness drift
Installation Notes:
Wiring Gauge: ≥14 AWG power cables for >75″ ECO screens prevent 1.8V line drop (3% loss).
Heat Clearance: Maintain >4.7 inches (120mm) rear gap for thermal convection – reduces fan runtime by 72%.
Statistically Guaranteed Savings:
95% probability of >33% power reduction using certified models (per NEMA LSD 45-2024).
3σ thermal stability (±1.7°C) prevents >2.1%/yr efficiency degradation.
Reliable Brand Options (Samsung, LG examples)
Opting for budget displays backfires with 3.2× higher service calls and 2,800–6,500 in hidden costs over five years—Samsung and LG panels achieve >99.992% uptime across 78 million operating hours in retail environments, backed by 95% first-fix resolution rates for certified technicians. Premium brands deliver industry-leading 11.5-year median lifespans (vs. 4.3 years for generics), reducing replacement cycles by 62%. While their 850–2,300 price premiums over no-name brands seem steep, $610/year savings in power (via 1.8 μW/cd efficiency) and 17-minute mean repair times (vs. 4.5 hours) justify the investment within 14–18 months.
Failure Rate Economics & Performance:
• Samsung QHC Series logs ≤0.07 module failures per 1,000 screens annually (based on 46,000+ deployments), translating to just 185/year in maintenance versus 2,260 for Tier-3 brands struggling with 9.4% annual part replacements – every dead pixel cluster costs 370–720 to fix after warranty, with generic 65″ screens accumulating 19.50/W in energy waste from ±23% voltage drift that cooks LEDs 47% faster; meanwhile, LG’s UltraSteady current drivers maintain <1.9% brightness decay over 18,000 hours (validated per IEC 62612), so a 3,900 86″ LG screen running 14h/day shows 1.31/hour cost efficiency at 0.14/kWh by year five versus $2.04/hour for off-brands due to their 52% shorter usable life.
Thermal & Color Consistency Engineering:
Samsung’s dual-loop cooling sustains ≤±1.4°F panel temperatures at 1,500 nits, preventing the >3.7% LED color shift common in cheap displays that fail Pantone Validated certification after 200 hours – critical for fashion retailers needing ΔE<1.0 apparel color matching, where LG’s NanoCell displays achieve 98.5% DCI-P3 coverage via 120 Hz refresh rates and ±0.0003 xy chromaticity coordinates, whereas generics drift >ΔE 5.3 under 8-hour loads; both brands guarantee MTBF ≥110,000 hours using automated SMT assembly lines with ≤0.00015% solder joint defects, cutting field failures to 1 per 290 units/year (vs. 1 in 17 for uncertified manufacturers).
Installation & Integration Savings:
LG/Samsung displays install 38% faster using precision magnetic mounts (85/unit) versus drilling 14–18 holes per generic cabinet, saving 220–390 in labor – their VESA DSC 1.2a chipsets push 4K video over single 48Gbps cables (vs. quad cables + 120 extenders for budget units) and support firmware updates in 1.7 minutes while retaining settings, unlike generics requiring 9–14-minute manual reconfigurations that drain 73/hour technician time; LG’s webOS-based signage slashes content setup from 2.3 hours to 18 minutes per screen using drag-and-drop templates, adding 18,700/year productivity value for chains with 50+ screens by sparing IT staff 23,000+ clicks annually.
Quantified Uptime & Support Advantages:
Samsung’s ProCare service delivers same-day onsite repairs for 92% of faults under contract (0.35/screen/day), including free loaner units during downtime, contrasted with 7.8-day average waits for third-party warranties yielding 1,840/hour revenue losses during promotions; LG provides real-time health tracking detecting ≥80% failures pre-outage via 1-second sensor polling, which cuts 95th-percentile repair costs to 160/incident while boosting system availability to 99.96% – this reliability is why 91% of Forbes Global 2000 retailers standardize on these brands, suffering 0.019/min/screen in operational losses versus $0.26/min for unbranded screens needing 3.6× more reboots.
Lifecycle Value Proof Points:
• A Samsung QMC 75″ display (3,100) over 8 years: 320 power + 400 maintenance + 370 calibration = 4,190 total cost
• Generic 75″ alternative (1,700) over same period: 890 power + 2,100 maintenance + 1,100 early replacement = 5,790
Net savings with premium brand: $1,600 per screen – plus 12–19% sales uplift from zero image retention (vs. screen burn-in within 8 months on budget IPS panels).
ROI Drivers Beyond Specs:
• Modular repairs save 840 per 86″ Samsung (replace 155 LED strip, not 990 entire module)
• Bulk discounts of 18–22% for 10+ units with free staging/QC (85/screen value)
• Asset value retention: 5-year-old LG displays resell for 32% MSRP (vs. 9% for generics).

Find Your Price Point (500 to 5000 range)
Retailers waste 6,900 per 10 displays by mismatching budgets with use cases—< 800 units fail 3.7× faster in high-traffic zones, while > 4,000 screens in backrooms yield < 4% ROI. Smart spending aligns specs to location value: 20/sq ft/month revenue zones (e.g., checkouts) demand 2,800–4,200 for 75″ 4K displays with ≥1,500 nits, whereas 3/sq ft stockrooms thrive with 550–820 55″ FHD panels at 500 nits. Balance upfront costs against 0.38–1.10/hour operating expenses; a 1,200 mid-tier model lasts 6.5 years with 0.47/hr run costs, outperforming 550 units needing $1.24/hr after 18 months due to repairs.
Price Tiers & Performance Correlation:
| Price Bracket | Screen Size | Brightness | Pixel Pitch | Power Draw | MTBF | Failure Rate |
|---|---|---|---|---|---|---|
| 500–900 | 55″ | 480–600 nits | P4–P5 | 210–240W | 34,000 hrs | 18%/yr |
| 1,200–2,100 | 65″–75″ | 1,000–1,300 nits | P2.5–P3 | 280–330W | 58,000 hrs | 7.2%/yr |
| 2,800–4,200 | 75″–86″ | 1,500–1,800 nits | P1.8–P2.2 | 350–430W | 82,000 hrs | 2.3%/yr |
| 4,500–5,000 | 86″–98″ | 2,000–2,500 nits | P1.5–P1.9 | 510–580W | 94,000 hrs | 1.1%/yr |
| Failure Cost Math: A 550 display with 29% annual failure risk costs 610 in repairs/yr—exceeding the $1,240 purchase price in 26 months. |
Hidden Cost Variables:
• Installation: Wall-mounting 82″ screens runs 87–230; ceiling drops add 310–790.
• Sensors: Ambient light detectors cost 40–160/unit but save 110/yr via auto-dimming.
• Calibration: Annual grayscale tuning runs 85–190/screen—critical for > 3,000 units to maintain ΔE<1.5.
• Power Infrastructure: > 86″ displays need 20A circuits ($420 upgrade) to prevent 12.8V voltage drops.
Location-Specific ROI Guide:
| Zone | Revenue Impact | Optimal Price | 5-Year Cost | Sales Lift |
|---|---|---|---|---|
| Storefront | 48/sq ft/month | 4,100–4,900 | 8,300 | 5.8–7.1% |
| Checkout Lanes | 22/sq ft/month | 2,200–3,300 | 5,100 | 3.9–4.8% |
| Aisle Ends | 9/sq ft/month | 1,400–1,900 | 3,600 | 2.3–3.1% |
| Back Office | 1.5/sq ft/month | 500–700 | 1,100 | 0.2–0.6% |
Profit Calculation: A 3,400 display driving 4.3% sales lift in 18,000/month checkout pays back in 3,400 ÷ (18,000 × 0.043) = 4.4 months.
Degradation Economics:
• Budget Screens (550): Lose ≥27% brightness/year, requiring replacement at 18–26 months.
• Mid-Range (1,900): Sustain ≥92% luminance after 3 years (0.18%/month decay).
• Premium ($4,500): Maintain >96% output for 6 years via ≤0.07%/month drift.
Total 5-Year Spend:
Cheap: (550 × 2 replacements) + 890 repairs + 1,020 power = 3,010
Premium: 4,500 purchase + 340 maintenance + 2,160 power = 7,000
Net Value: Premium saves $0.19/hour operational cost and 72 staff minutes/month troubleshooting.
Discount & Procurement Tactics:
• Bulk Buys: Order 6+ screens for 11–18% discounts + free shipping (175/screen value).
• Refurbished Premium: 3-year-old Samsung/LG units cost 42–48% less with 92% remaining lifespan.
• Lease Options: 0 down, 67/month for 86″ screens – tax-deductible OpEx vs. CapEx.
• Closeout Models: Last-gen 75″ 4K panels clear at 1,200–1,600 (was 3,100) when new tech launches.
Real-World Cost Case (Urban Apparel Store):
• Location: 2,800 sq ft store with 3 displays
Entrance: 86″ Samsung ($4,100)
Checkout: 75″ LG ($2,300)
Fitting Area: 65″ mid-tier (1,420)
• 5-Year Total Spend: 7,820 hardware + 1,130 install + 2,650 power + 810 maintenance = 12,410
• Revenue Impact: 7.1% avg. sales lift = 228,500 incremental revenue
• Net ROI: (228,500 × 0.38 margin) – 12,410 = 74,420 profit → $14,884/year per screen.


![How to Choose a Flexible LED Display [Buyer's Guide]](https://www.szradiant.com/wp-content/uploads/2025/12/How-to-Choose-a-Flexible-LED-Display-Buyers-Guide-1-300x180.jpg)


